
Consensus & statistics · Administrator
Understand statistics and “Group Stability”
Enable the measures you need before launch and distinguish within-round agreement from change between rounds.
Screenshots from the original Surveylet guide illustrate the controls below. Layouts and labels may vary with your survey configuration. Select an image or “View full size” to open it in a new tab.
Enable statistics before collection
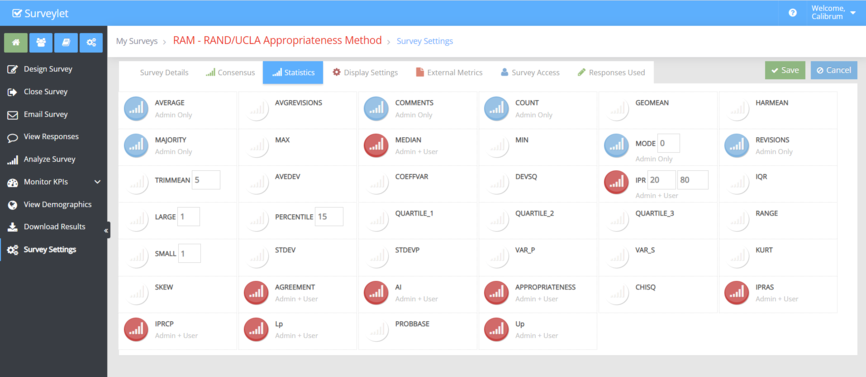
In Survey Settings → Statistics, available display states include Admin Only, Admin + User, and Disabled. The question’s Statistics to Display list further controls what appears under that question.
Newly enabled statistics are calculated on subsequent answer or revision events. Their earlier historical values are not backfilled. Enable the measures needed for the study before data collection.
Read the common statistics
| Measure | Plain-language meaning |
|---|---|
| Median | Middle of the ordered ratings. |
| Mean | Arithmetic average of the numerical values. |
| Mode | Most frequent value or category. |
| IQR | Spread of the middle half of the ratings. |
| Standard deviation | Variation around the mean. |
| Percentage in a range | Share of valid ratings falling in that range. |
Choose measures that fit the data. Category identifiers are labels; their numeric codes do not create meaningful averages. Ordered ratings and measured numerical quantities may require different interpretation.
More screenshots and examples (1)
Group Stability is method-dependent
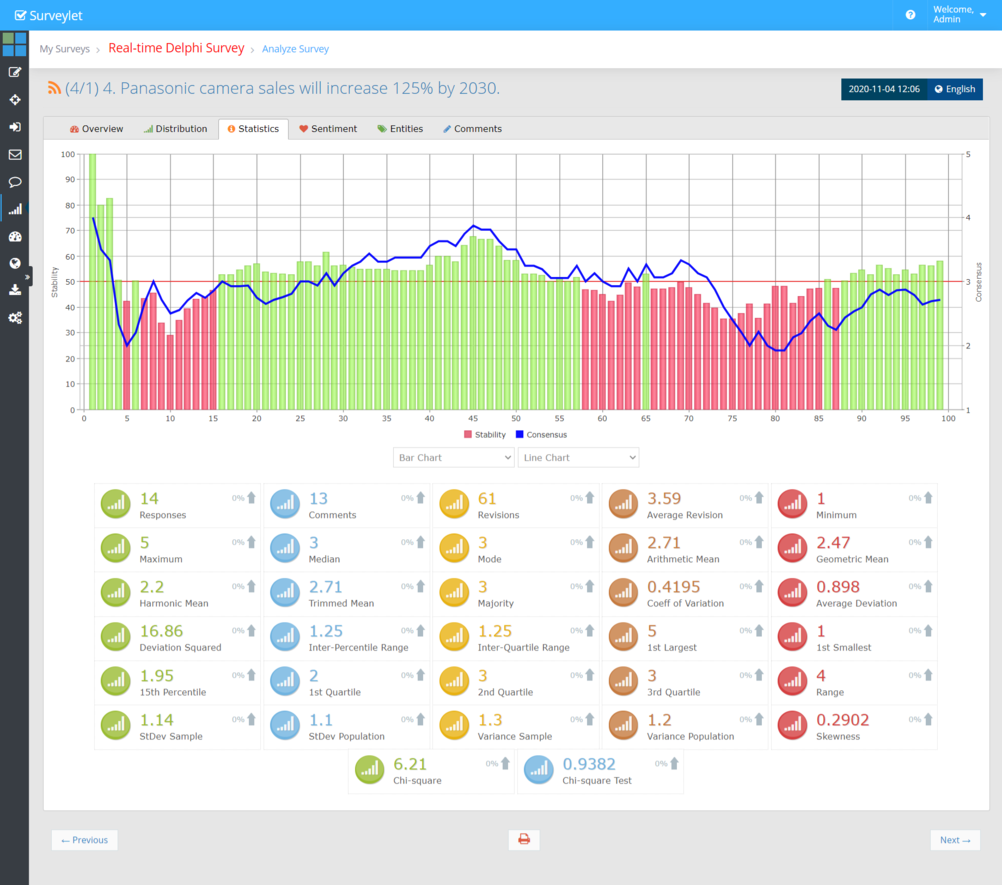
Surveylet’s Group Stability label describes the strength or concentration of agreement for the selected method. It is not automatically evidence that a panel’s opinions stopped changing between rounds. For percentage-based methods, the displayed value is tied to choice or range agreement; coefficient-based methods use a different calculation.
To evaluate round-to-round stability, compare the relevant datasets and measures over rounds according to your protocol. A high within-round agreement level and a small change between rounds answer different questions.
Check coefficient-based examples
The documented Likert Mean/CV example uses sample standard deviation and Group Stability = 100% − CV. Its numeric-entry example instead uses population standard deviation divided by the allowed value range and Group Stability = 100% − 2 × that ratio. These are different calculations.
Do not apply one formula to every question type. Validate the output with the actual question settings and known data, and describe the selected method explicitly in your report.
Common questions
Why does a newly enabled statistic have no earlier history?
Historical values are stored when answer or revision events occur while the measure is enabled. Enabling it later does not recreate those earlier events.
Is “Group Stability” the same as a stopping rule?
No. Your stopping rule is a study decision, such as a planned number of rounds or a defined change criterion. The displayed Group Stability value alone does not implement that decision.