
Results & exports · Administrator
Analyze results by stakeholder group
Connect demographic KPIs to collected answers and compare subgroups using consistent rules and denominators.
Screenshots from the original Surveylet guide illustrate the controls below. Layouts and labels may vary with your survey configuration. Select an image or “View full size” to open it in a new tab.
Prepare the grouping question
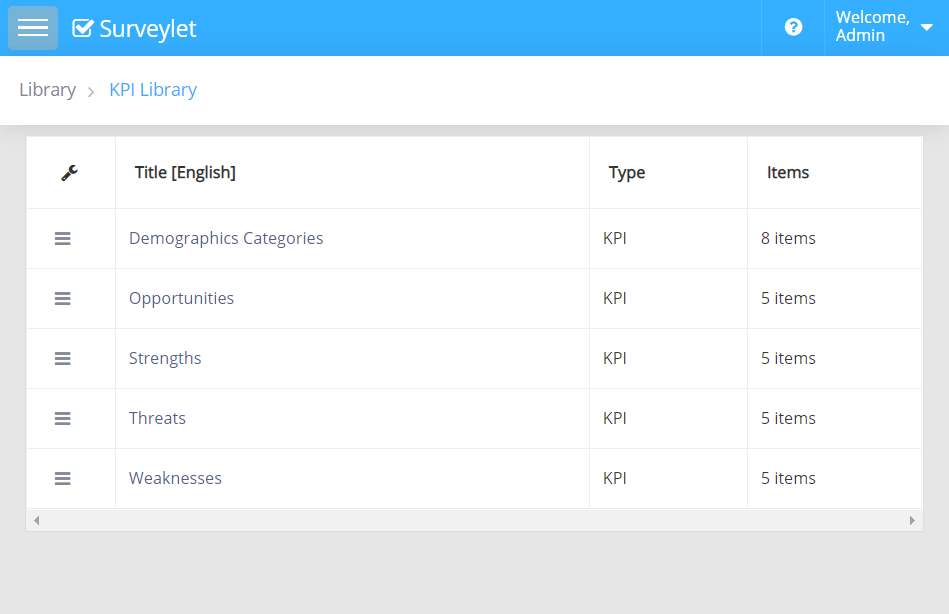
- Create the relevant KPI under Library → KPI Library → Demographics Categories.
- Assign it to the question that collects the stakeholder characteristic.
- Use clear, stable group labels. Avoid assigning the same demographic KPI to more than one question in a survey.
- Test the saved demographic selection and confirm that it is available in View Demographics.
Run the analysis
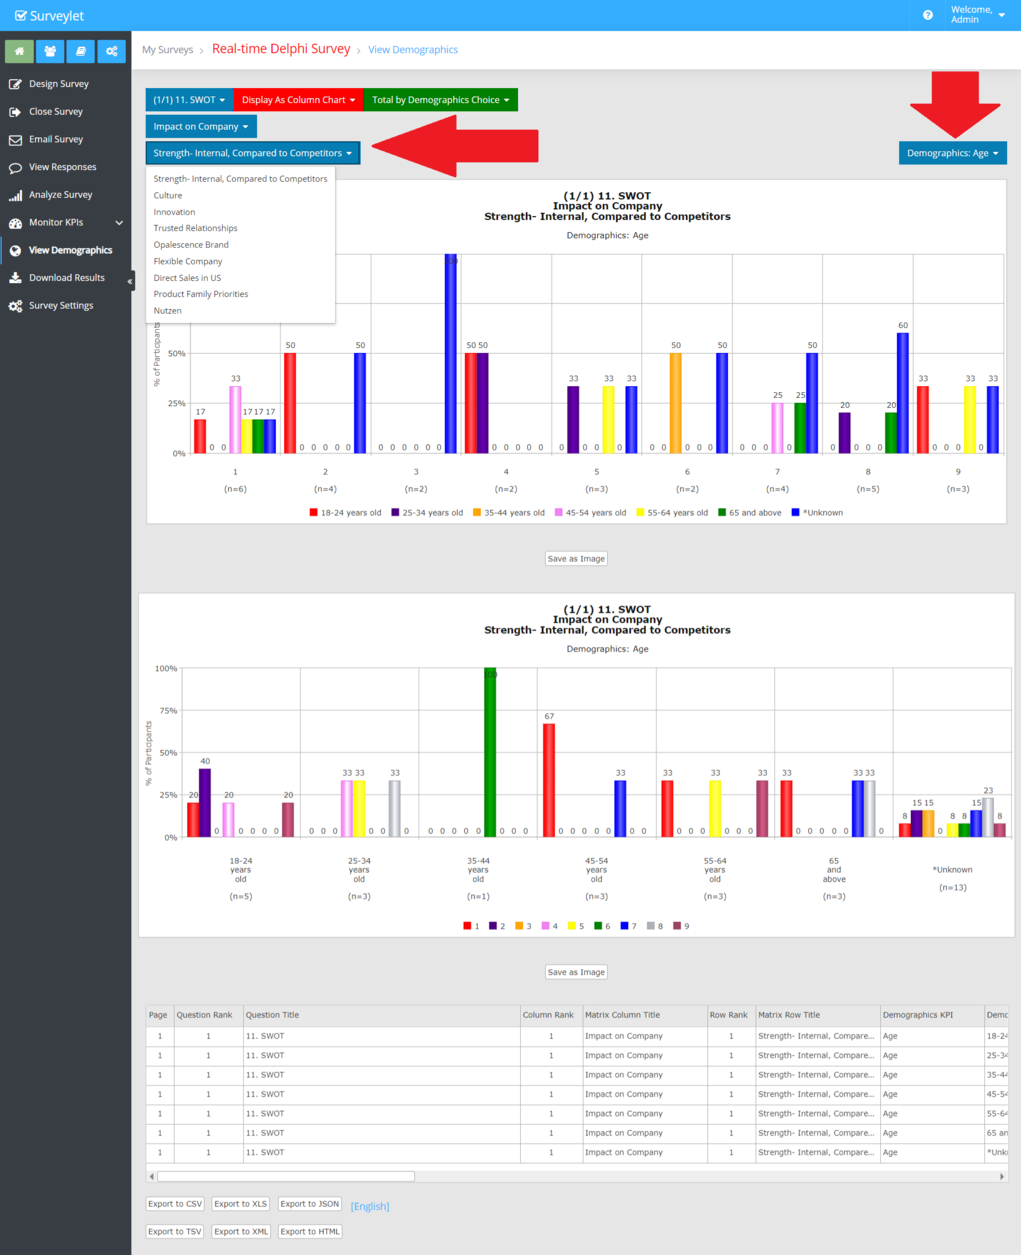
Open View Demographics. Choose the study question or matrix cell, then select the demographic question from the demographic selector. Review the charts and exported data for the relevant subgroups.
You can save an available chart as an image or export the underlying data. For publication, check the journal’s required dimensions and file format; a small screenshot may be inadequate even when it looks clear on screen.
Show subgroup feedback to participants
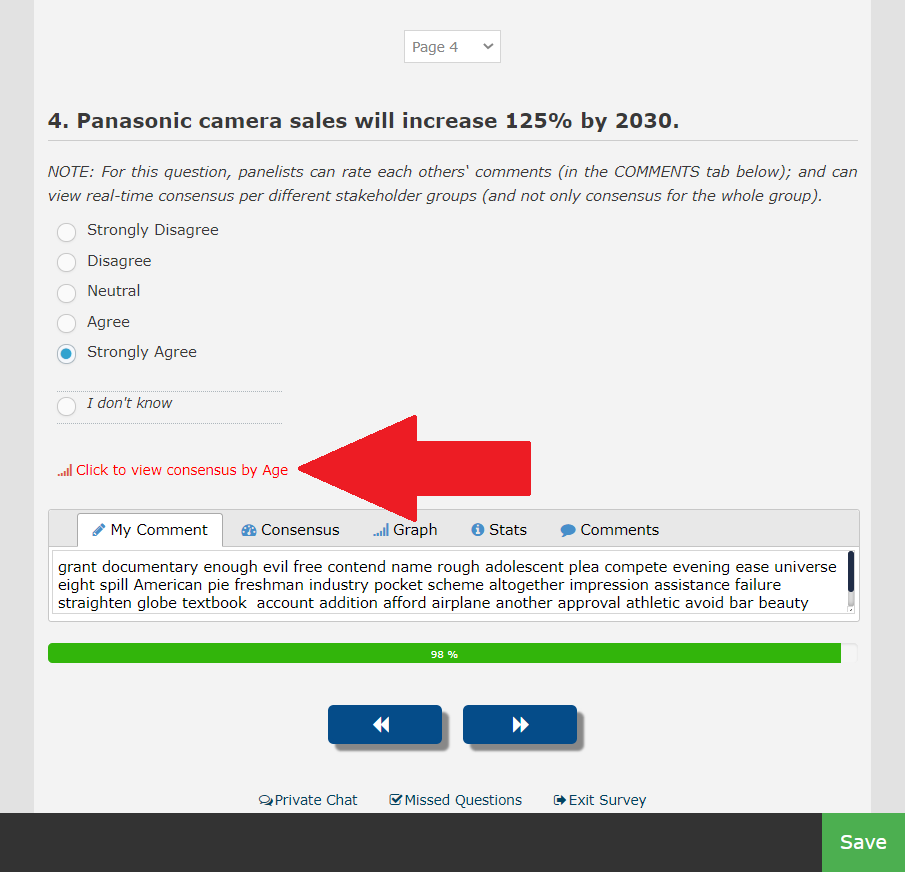
In the relevant question or matrix-column settings, select Display Demographics Report and the intended demographic KPI. Choose the report label and style.
| Style | Documented behavior |
|---|---|
| Popup Link | Can display subgroup consensus and distribution with real-time updates. |
| Embedded Charts | Displays subgroup distributions; the legacy guide does not describe real-time streaming or consensus output for this presentation. |
Check whether the subgroup display is appropriate for the panel. Small groups, role labels, or detailed comments can make identities easier to infer.
More screenshots and examples (1)
Keep comparisons interpretable
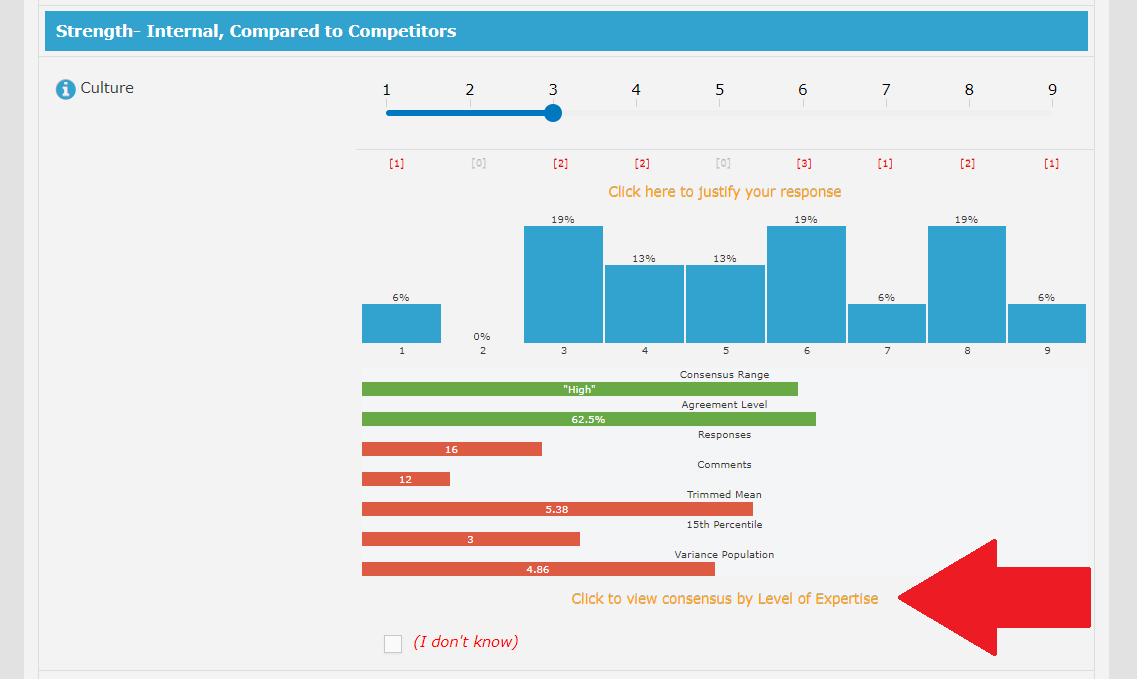
Report each subgroup’s valid answer count and apply the same pre-specified criterion unless the protocol defines a group-specific rule. Do not treat a combined-panel consensus as proof that every stakeholder group agrees.
Advanced role-to-group mapping can populate a hidden demographic grouping question from a selected role. Confirm the KPI names and mapped choice positions, then test every role.