Results & exports · Administrator
Read the analysis pages and historical charts
Select the question and round, inspect distributions and statistics, and interpret revisions as events rather than new participants.
Screenshots from the original Surveylet guide illustrate the controls below. Layouts and labels may vary with your survey configuration. Select an image or “View full size” to open it in a new tab.
Select the dataset
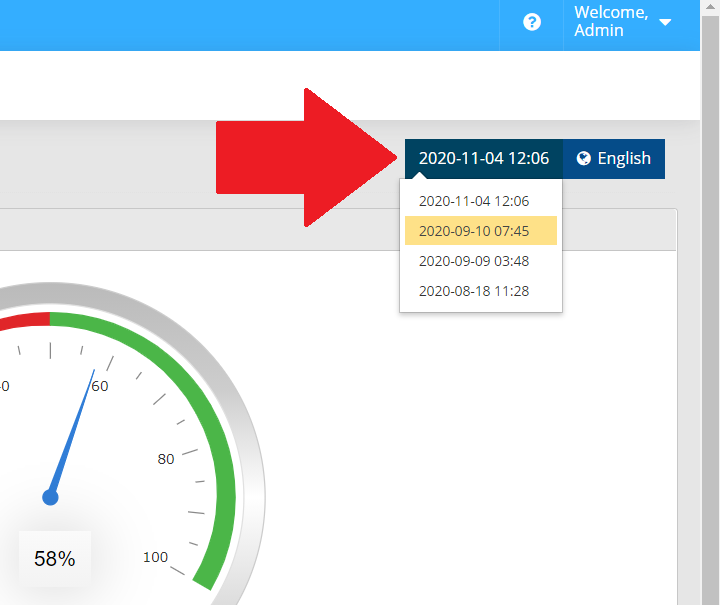
Open Analyze Survey, choose the relevant question or matrix cell, and select the survey round. Check the language and any filters before comparing results.
| Tab | Purpose |
|---|---|
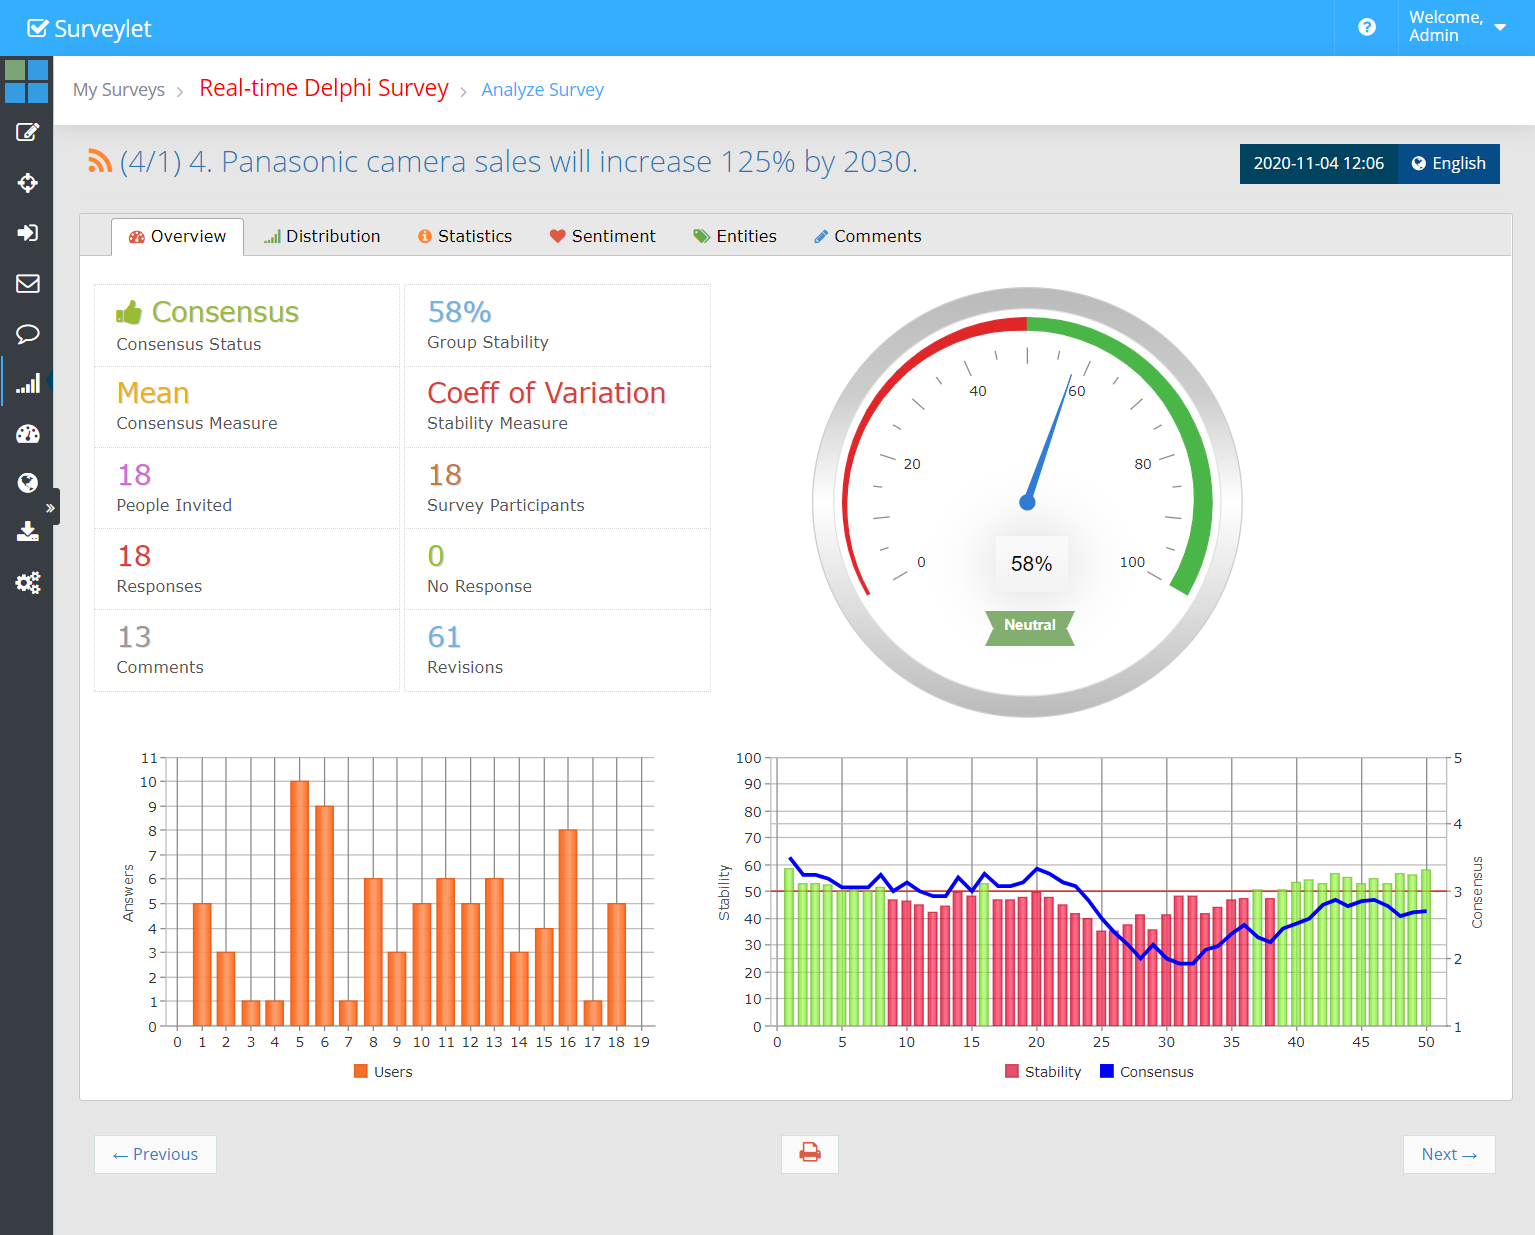
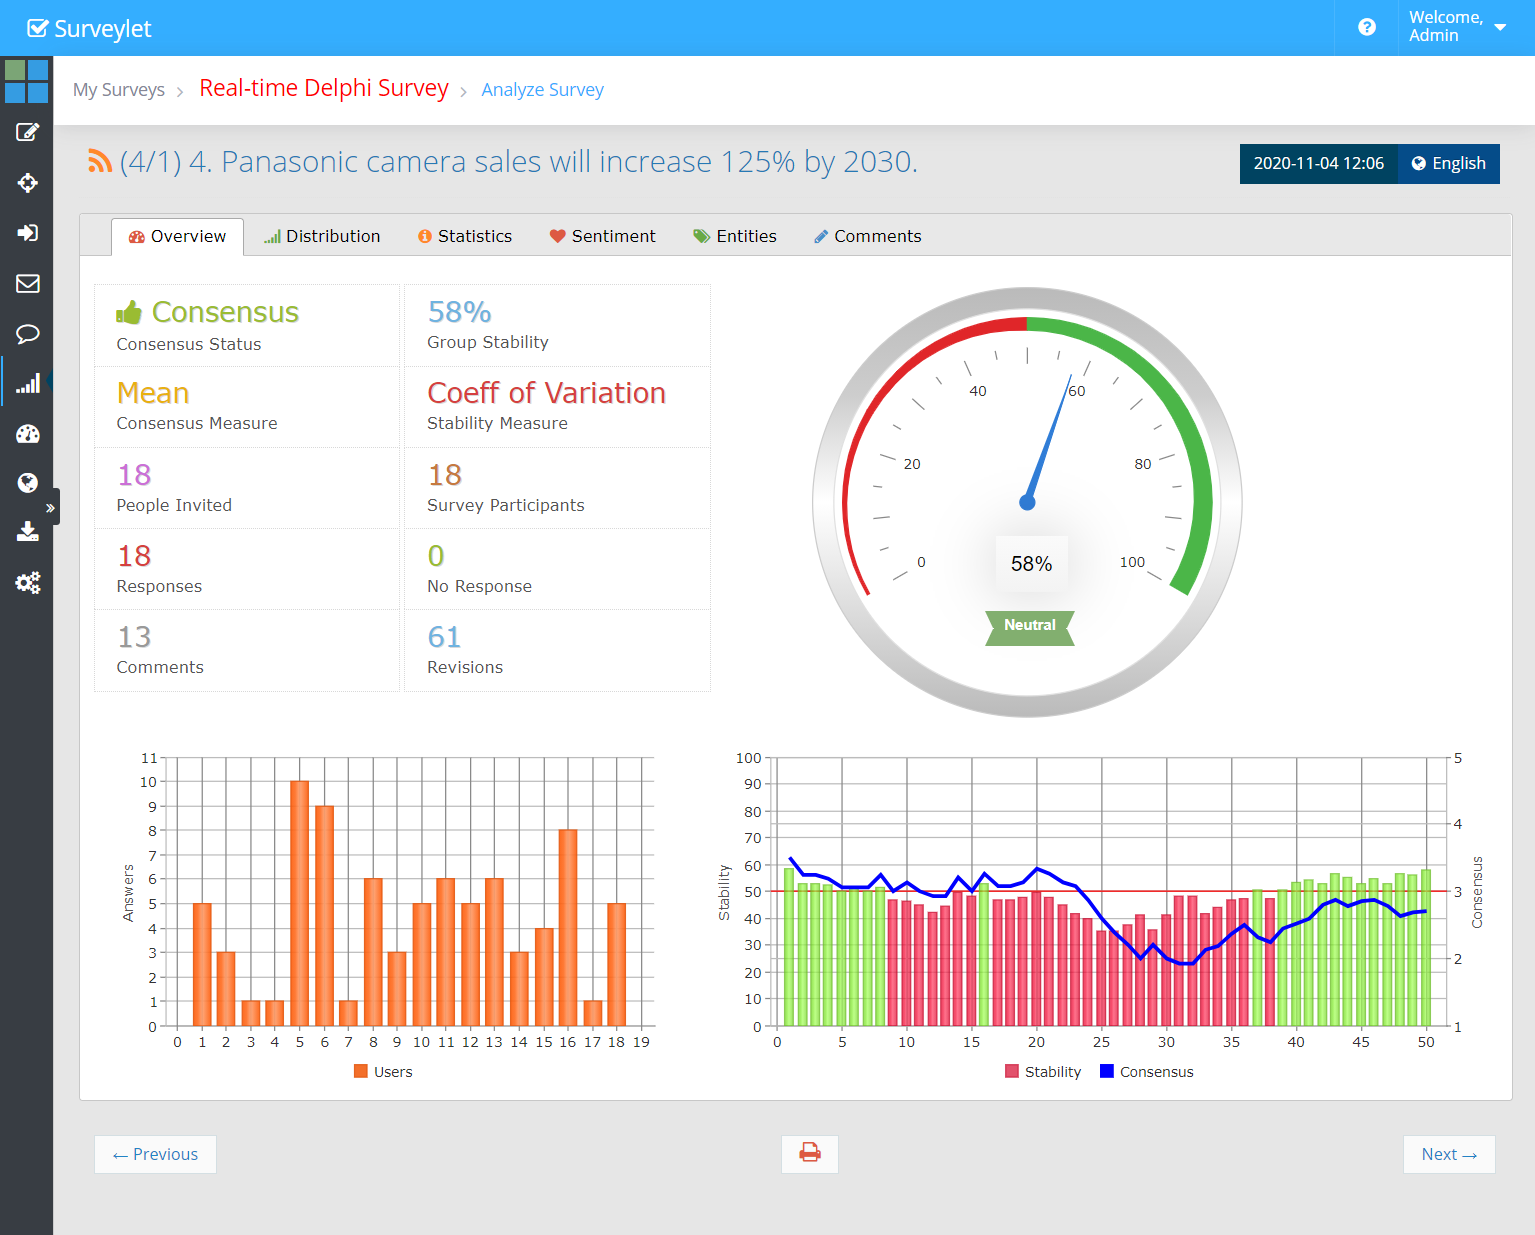
| Overview | Consensus status, group stability, respondent activity, and changes over answer events. |
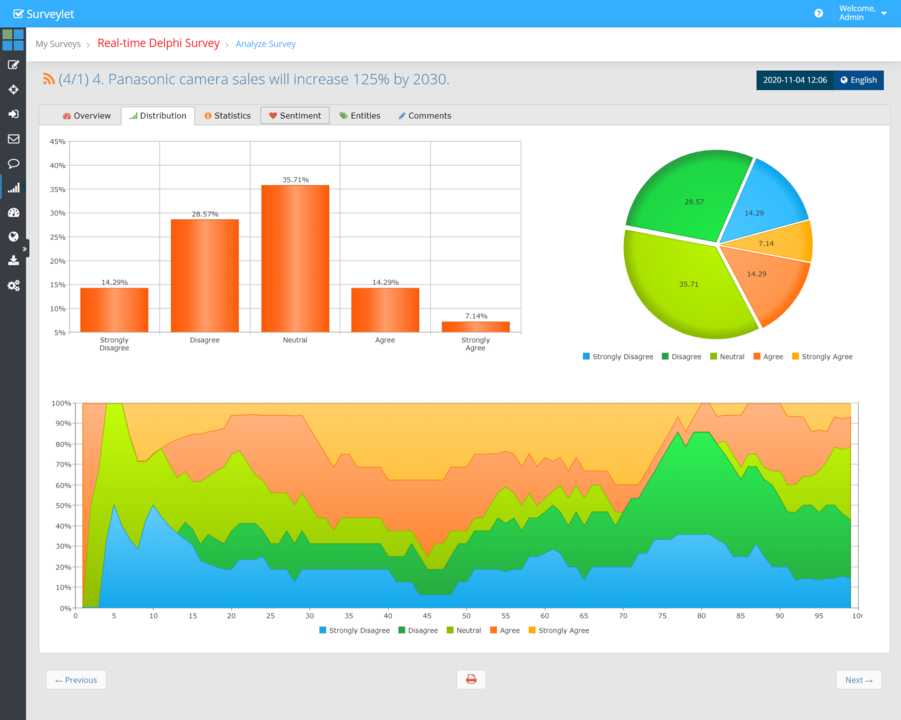
| Distribution | Counts or percentages across choices, with available charts and history. |
| Statistics | Enabled numerical measures and their histories. |
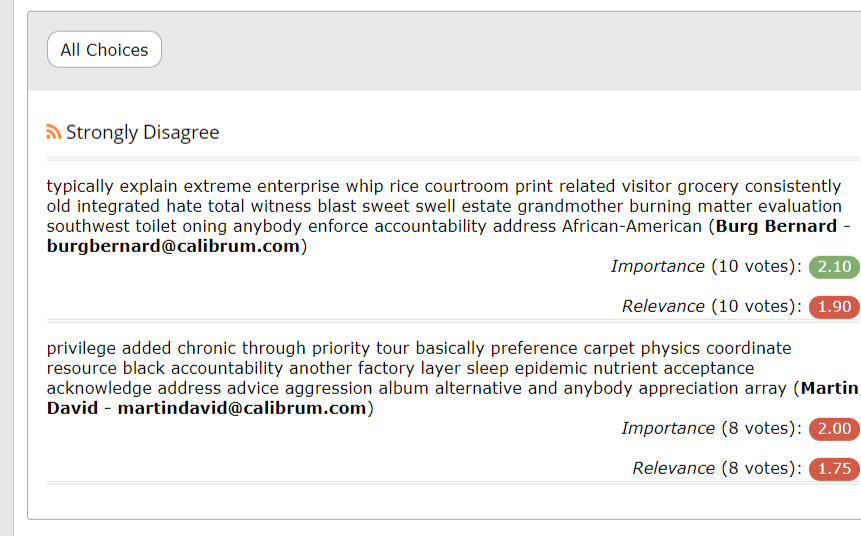
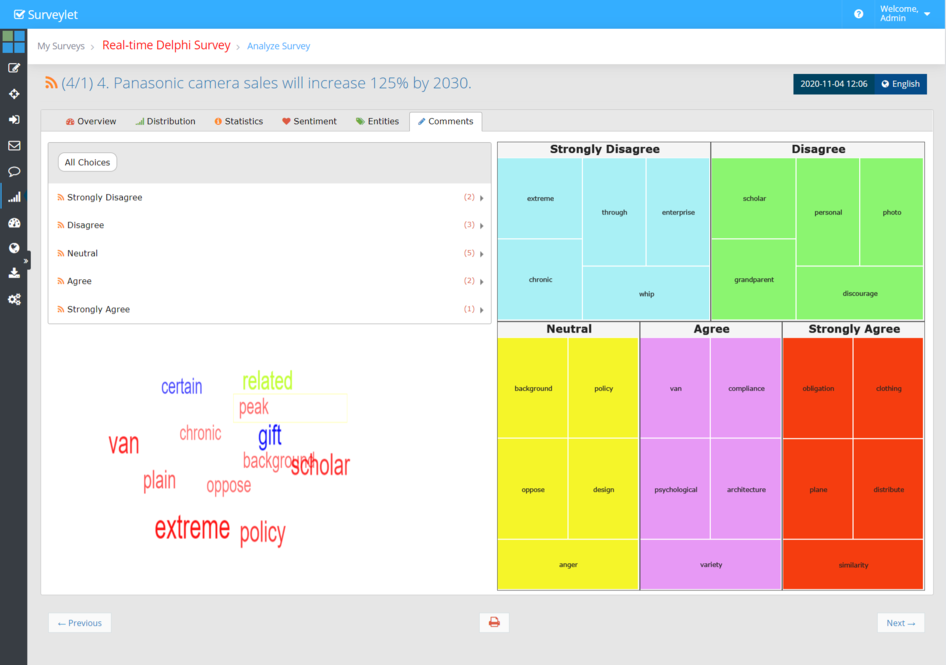
| Comments | The panel’s written reasoning. |
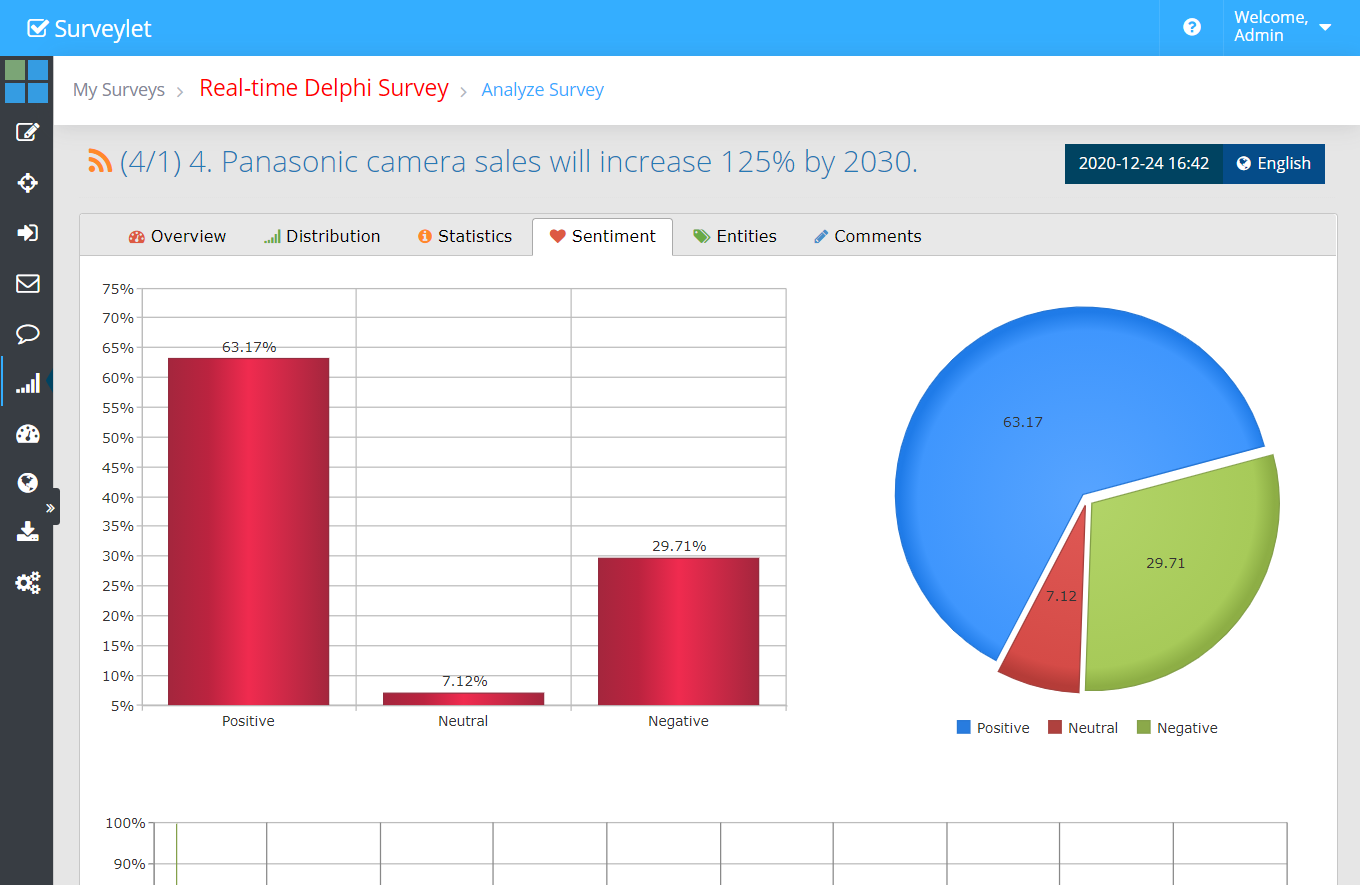
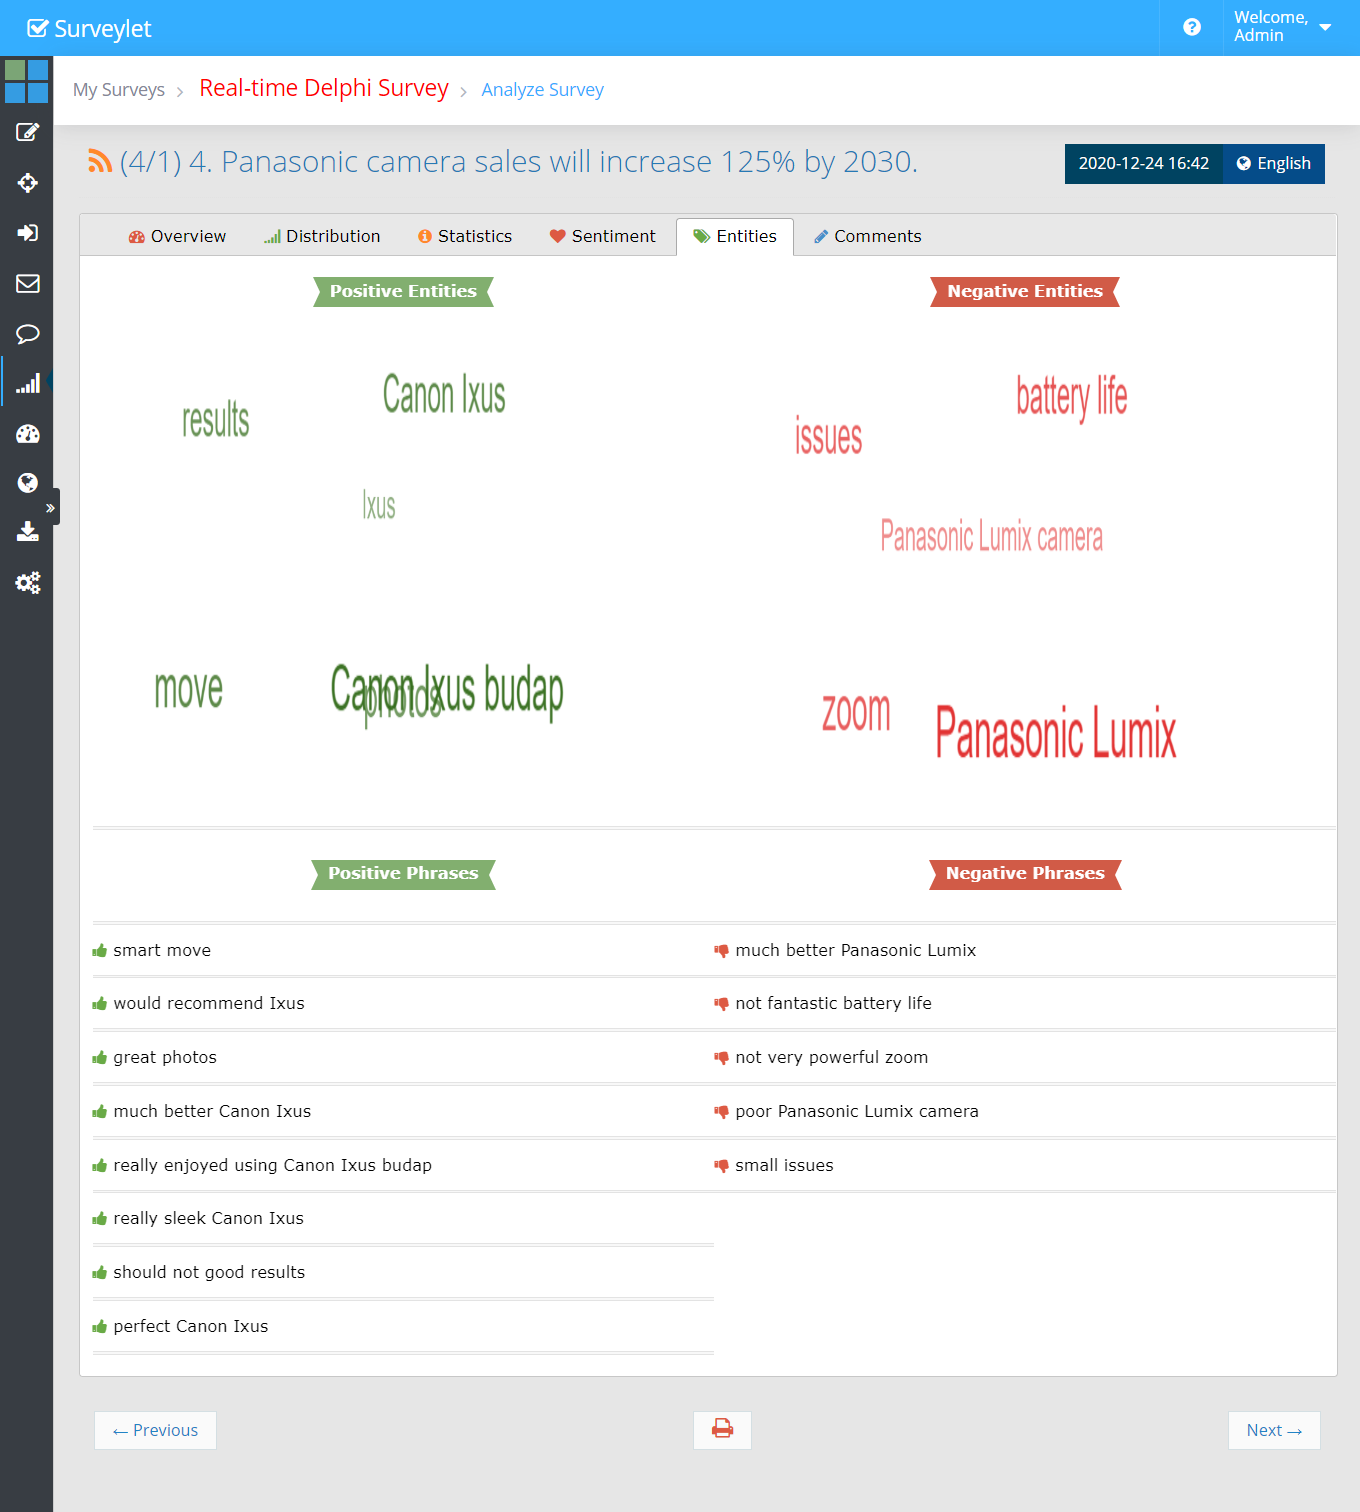
| Sentiment / Entities | Optional NLP outputs where the service is enabled. |
More screenshots and examples (1)
Interpret the timeline
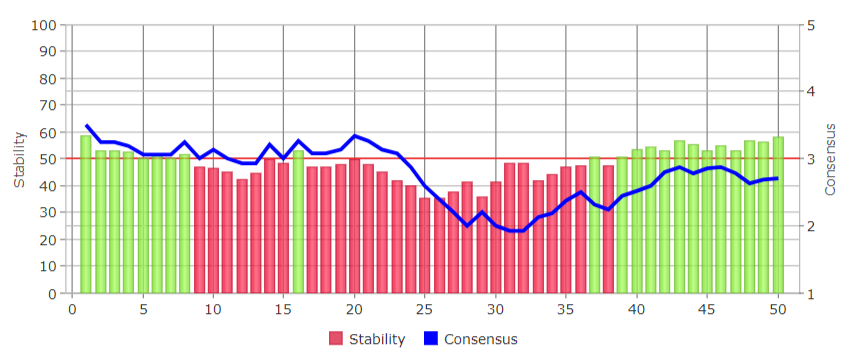
A chart event can be a new answer or a revision to an existing answer or comment. Events need not occur at equal time intervals. Ten displayed events do not imply ten people or ten days.
Check the chart’s displayed window and round selection. Historical graphs do not automatically constitute a protocol-defined stability assessment. Use the underlying exported data when you need reproducible calculations.
More screenshots and examples (2)
Written input and optional NLP
Read comments in context. Optional Natural Language Processing can provide sentiment, entity, and phrase outputs when enabled for the account. It is separately licensed and is not a substitute for reviewing the meaning of research responses.
If your project restricts third-party text processing, confirm that NLP is disabled before data collection. Do not describe sentiment scores as consensus or assume the service is included with every account.
More screenshots and examples (3)